
Blog
Creating reports in Salesforce Classic
“Not only are bloggers suckers for the remarkable, so are the people who read blogs.” - By Delipat
Creating reports in Salesforce Classic

Reports are necessary for Salesforce developers as a service because they enable data analysis, performance monitoring, compliance tracking, user insights, and client communication. These reports are essential tools for developers to tailor Salesforce solutions to their clients’ needs, make data-driven decisions, ensure regulatory compliance, and continuously improve system efficiency and effectiveness.
We can create reports in both classic and lightning interfaces. Reports created in classic can be viewed and edited in Lightning and vice versa. Salesforce Classic helps us create reports in a simpler manner than Lightning.
How to create reports in Salesforce Classic?
Click on the user icon.
Click on Switch to Salesforce Classic.
Select Sales application.
Go to the Reports tab. If you don’t find the reports tab on the tab bar, click on the + symbol on the bar. Use ctrl+F to find reports and click on it.
Select the sales report folder. You will be able to view the opp report we created in the lightning interface. Click on the opp report to see how the report looks in Classic. You will not be able to see the chart, as the chart option is not available in Classic.
To create a new report, go to reports and click on the new report button.
Select the report type- Opportunity
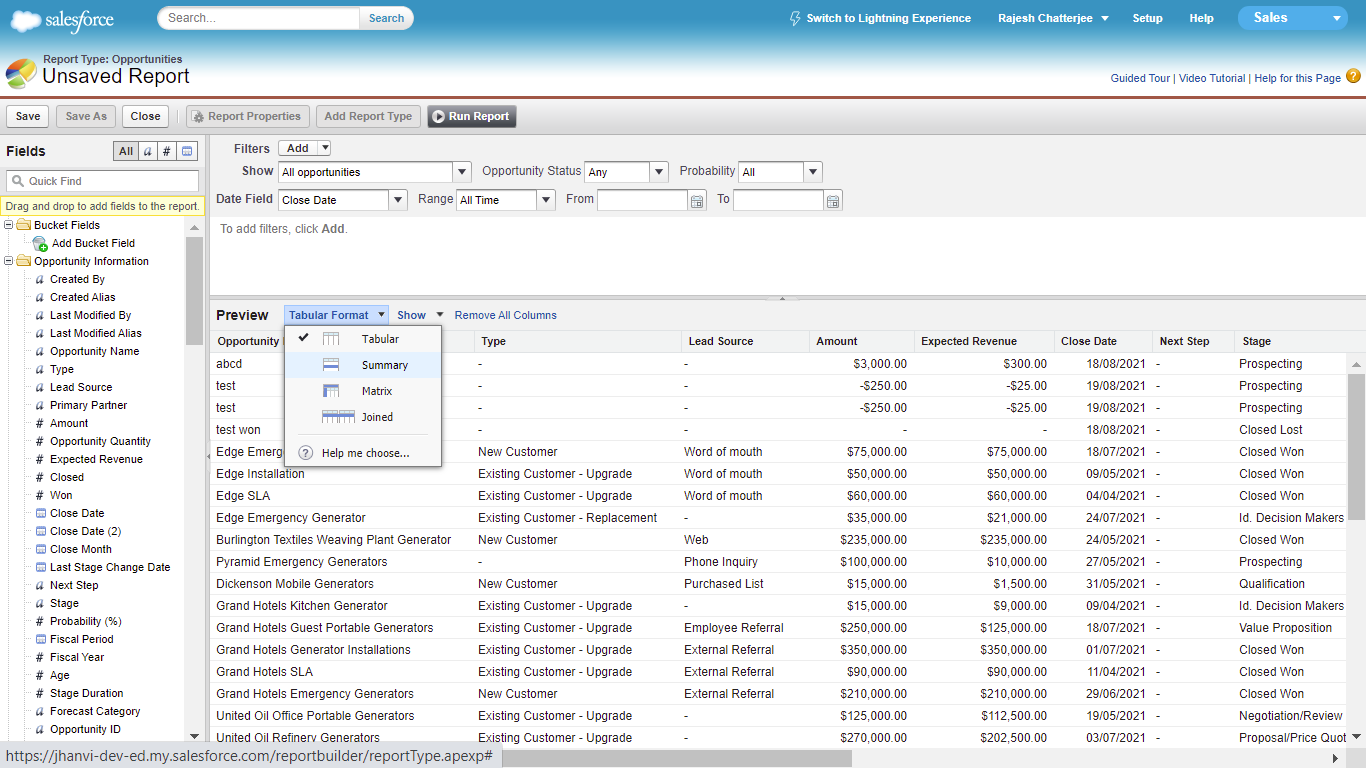
You will land on the report builder page.
The preview panel contains all the records.
On the left, you can see all the fields. You can drag the fields you want in the report and drop them in the preview panel and vice versa.
All the filters are available on the top of the preview panel.
Make the range- all time
Salesforce Classic allows you to select and create four different types of reports- tabular, summary, matrix, and joined. You can create all four in Lightning as well. But it does not have bifurcation.
Tabular report.
The tabular report is selected by default.
Tabular report- Looks like Excel. You cannot group the record in tabular form in Classic.
Summary Report
Click on the arrow near tabular format and select summary report.
You can group the records in summary reports.
Drag and drop the field in the space written- Drop a field here to create a grouping. You can add charts by clicking on the Add Chart button.
You can drag and drop multiple fields into the group.
Matrix report
Now, Select the matrix report.
In the matrix report, you can group in rows and columns. It is a little more complex than a summary report to view.
Drag and drop the stage field in the column and type in the row.
Joined report
Now, Select joined report.
In the joined report, you can join two reports and compare them simultaneously.
Example- business wants a joined report of sales last month and this month
To another report, click on Add report type on the top of the page.
Add report type- opportunities with product
Remove unwanted fields.
You can group join reports also. Make sure the field to group by is common to both reports.
We will Group it by stage field.
Click on Save.
Give a name- Opp report in classic
Choose folder- sales report
Click on Save.
Our report is created in Salesforce Classic.
Let us go to Lightning and view the report.
Switch to Lightning by clicking on Salesforce Lightning on the top.
Go to the Reports tab. Click on the Opp report in classic.
You can edit the report, add and remove filters and charts, and also add blocks. By adding blocks, you can add another report type in Lightning.
Note- Always run the report to see how the business user can visualize the reports.
Additionally, reports serve as a crucial means for Salesforce developers as a service to troubleshoot issues within applications by providing insights into data anomalies and patterns. They aid in decision-making regarding system architecture, data modeling, and feature development, facilitating informed choices that benefit clients and organizations. Ultimately, reports empower developers to enhance user experiences, measure the impact of changes, and maintain transparency in their Salesforce implementations, ensuring ongoing success and satisfaction for their clients.

Delipat IT is a leading provider of innovative Salesforce implementation and consultation services for businesses of all sizes. With a strong focus on delivering tailored services, Delipat IT has earned a reputation for excellence in the industry.
Contact Info
2nd floor, Phase 2, Webel IT PARK, Palashdiha, Industrial Area, Durgapur, West Bengal 713208
© Copyright 2024 Delipat